
Construction-induced soil compaction in agri-photovoltaic systems: evidence from an Arenosol
Agri-photovoltaic (Agri-PV) systems, which combine crop production with solar energy generation, are rapidly expanding across Europe, yet their implications for soil quality remain poorly understood. This study assessed soil compaction following the installation of an Agri-PV system in autumn 2024 on an Arenosol in Brandenburg, Germany. Bulk density (BD) and penetration resistance (PR) were measured across multiple depths after construction finalization. Both parameters were compared to a nearby reference and established agronomic thresholds. Subsoil BD in construction zones (1.67–1.69 g cm⁻³) exceeded root growth thresholds, while PR at mid-depth reached 3.7–4.1 MPa, surpassing the limit for root elongation. Our results align with literature indicating that Arenosols, due to their weak structure and lack of shrink-swell capacity, are highly vulnerable to persistent compaction. The observed compaction poses risks to rooting depth, water infiltration, and crop yield, underscoring the need for targeted mitigation measures. We suggest that pedological construction supervision should become standard practice for Agri-PV projects, ensuring soil protection measures are integrated into planning, construction, and restoration. More flexible policy frameworks and monitoring of soil recovery post-installation are needed for aligning renewable energy expansion with sustainable crop production.
Introduction
Agri-photovoltaic (Agri-PV) systems, which combine agricultural production with solar energy production, are rapidly expanding across Europe as part of renewable energy strategies, making them an essential component for climate change mitigation1, 2. In Germany, expansion targets increasingly focus on co-utilized areas, including Agri-PV systems, parking lots and floating systems to reduce land-use competition3. Agri-PV systems align with sustainable agricultural transformation goals, as they offer potential synergies between food production, renewable energy generation, and biodiversity conservation4 while enhancing societal acceptance of renewable energy. The establishment of integrated production and distribution systems within Agri-PV is expected to unlock systemic innovations, moving these systems from niche to mainstream applications5.
Agri-PV systems alter microclimatic production conditions such as radiation, temperature, and soil moisture, which can affect crop yields depending on site conditions and crop type6, 7, 8, 9, 10. These subsequent effects during system operation must be clearly distinguished from soil disturbance occurring prior during the construction phase. While most research has focused on agronomic effects of running Agri-PV systems, soil disturbance during construction and its long-lasting impacts on soil physical functioning remain largely unquantified. A significant trade-off, particularly regarding soil health (here understood as soil physical functioning11) during and after installation has been reported already for common solar panel power plants installed over soils that are left fallow12. The Agri-PV construction process involves the use of heavy machinery for material transport and structural installation, which may contribute to soil compaction. Soil degradation due to soil compaction is a continuously growing threat by heavy agricultural machinery used for all sorts of field interventions and crop production steps13, 14. Compaction reduces soil porosity and hydraulic conductivity, restricting root growth and water infiltration15, 16. These soil processes are particularly critical in agricultural systems, where healthy, non-degraded soils contribute to both crop productivity and ecosystem functioning, such as carbon storage and water cycle regulation17, 18.
The degree of soil compaction caused by farming as well as construction machinery is strongly controlled by soil type, moisture content, and traffic frequency. Coarse-textured soils like Arenosols with low organic matter and buffering capacity exhibit lower structural stability and limited water retention due to their larger particles and pore spaces19. This makes them less reactive to compaction compared to finer-textured silty or clayey soils like Luvisols, which are more vulnerable when moist20. However, once compacted, sandy soils have limited ability for spontaneous recovery and require alleviation and amelioration measures21. These contrasting responses highlight the importance of pedological context when assessing construction-related soil impacts in Agri-PV systems. Key indicators of soil compaction include bulk density and porosity, which are strongly related to soil structure and soil moisture in soils with shrink-swell properties22, 23. The upper soil layers are mostly affected by compaction, which directly inhibits root growth during early crop establishment13, 24. Another relevant compaction parameter is soil penetration resistance, which informs about the vertical distribution patterns of compacted soil layers and depends on bulk density, soil texture and soil moisture 25, 26. Despite the rapid expansion of Agri-PV across Europe, empirical studies quantifying soil compaction caused by installation activities remain extremely limited.
Efforts to mitigate construction-induced compaction in Agri-PV systems emphasize adopting best practices such as using lighter machinery and/or mobile construction roads, avoiding high-traffic zones during installation, and scheduling the construction during periods of low soil moisture and thus precipitation27, 28. However, economic constraints, logistical challenges, and policy-driven timelines often limit the consistent implementation of these measures. To date, experimental studies have primarily reported post-installation soil effects in common PV facilities, including spatial heterogeneity in soil moisture and unsaturated hydraulic conductivity due to the photovoltaic array29, as well as reduced mean weight diameter of soil aggregates and porosity following solar park construction30.
Recent reviews highlight the limited understanding of soil physical responses and pedogenic processes under Agri-PV systems, particularly regarding construction-induced impacts and their spatial heterogeneities to detect main drivers for future crop development and yield performance31, 32, 33. This study addresses the knowledge gap on construction-induced soil compaction in Agri-PV systems. We hypothesize that heavy machinery traffic during installation leads to spatially heterogeneous but persistent soil compaction in an Arenosol exceeding critical thresholds for root growth. For this, we aimed to quantify bulk density and penetration resistance across depths and locations within an Agri-PV system and relate these patterns to potential implications for soil functionality and crop production. This case study provides transferable insights into soil risks associated with Agri-PV expansion under comparable pedological and climatic conditions.
Results
Soil properties
The soil analysis showed considerable variation in both physical and chemical properties across the experimental site (Table 1). Higher carbonate (TIC) concentrations were observed in the second and fifth depth increments, contributing to total carbon content in the Agri-PV site. Organic carbon levels above 1% were found only in one sample (D2, 12–17 cm depth) in transect 2, suggesting past accumulation that may have been redistributed to deeper layers, possibly due to plowing during site preparation. The control reference site also contained one sampling point in the topsoil (D1) of transect 4 with 1.38% TOC which aligns with its long fallow history and organic matter accumulation. Soil texture varied but was predominantly sandy, with occasional clay layers at two points of transect 3 in 20 to 50 cm depth containing up to 15–17% clay, and a pronounced silty layer in 20–25 cm at one of the control sites in transect 2 (Table 1). Higher soil pH above 7 was found in samples containing carbonates, particularly in deeper layers, while topsoil samples generally resulted in lower pH levels.
Table 1 Physical and chemical soil properties at the experimental site (Ct: total carbon in %, Nt: total nitrogen in %, TIC: total inorganic carbon in %, TOC: total organic carbon in %, TC: total carbon as sum of TIC & TOC in %, pH: Soil pH with KCl extraction, Clay, silt and sand content in %, KA5: Bodenkundliche Kartieranleitung (Ad-Hoc-AG Boden34; German soil textural classes: Su2 = slightly silty sand, Su3 = medium silty sand, Su4 = strongly silty sand, Sl2 = slightly loamy sand, Sl4 = strongly loamy sand), θ₃₃ (FC, %): estimated field capacity at pF ≥ 1,8; % SMgrav: gravimetric soil moisture content at bulk density sampling in %; BDcorr: stone-corrected bulk density in g cm-3; 2D: 2D tracker system, Con: control reference site) across four selected transects (T1-T4) and five depths (4–9 cm (D1), 12–17 cm (D2), 20–25 cm (D3), 45–50 cm (D4) and 70–75 cm (D5). Figure 8 D depicts the random distribution of sampling points for chemical analysis. na: not available due to low amount of soil sample mass, high stone content.
Soil moisture
Soil moisture was spatially heterogeneous across the transects (Fig. 1). Volumetric soil moisture in T2, T3 and T4 consistently exceeded 20%, whereas moisture in T1 and T5 remained below 17%. Volumetric soil moisture in T3 and T4 resulted in a sharp drop shortly after sensor installation on 5th of December. Soil moisture levels remained relatively stable from mid-December onwards, with only gradual declines likely reflecting drainage under low temperatures and absence of vegetation. However, pronounced moisture differences between transects may also have contributed to penetration resistance pattern measured on 17th of December with T1 having only around 14%, followed by T5 with 16%, T2 with 20.5% of soil moisture and T3 and T4 having 22% each (Fig. 1). Overall, the recorded values showed generally moist towards saturated soil conditions in 45 cm depth after the construction phase ended. Gravimetric soil moisture obtained during bulk density sampling on 25th November showed lower, but less variable moisture levels across depths, with values at 45–50 cm ranging between 11% in T3 and 15% in T2. More variable gravimetric soil moisture between 10% (T5) and 23% (T1) was measured in 75 cm depth, stating generally moist, but not fully saturated subsoil conditions (data not shown). Combined with precipitation totals of 52.6 mm in November and 40.6 mm in December and low average temperatures (< 5 °C), the measurements indicate generally moist subsoil conditions during the sampling period, but mostly below estimated field capacity (between 20 and 25 vol.-% for the slightly silty sand soil type, Table 1).
Fig. 1

Hourly volumetric soil water content (vol.-%) averaged for three centric sensors per transect (T1 to T5, compare location in Fig. 8 D) at a depth of 45 cm and hourly accumulated precipitation in mm in December 2024.
The observed variability in soil texture, nutrient concentration and soil moisture content indicates a heterogeneous site, which may contribute to spatial variability in bulk density and penetration resistance alongside construction-related effects.
Bulk density
Bulk density was significantly higher in 2D and 3D Agri-PV systems compared to the control site (Con) in four out of five depth intervals, with no significant differences observed between systems in the 20–25 cm depth interval (D3) (Fig. 2). In the subsoil, the control site exhibited significantly lower bulk density values, averaging 1.34 to 1.14 g cm−³ in D4 and D5, respectively, while bulk density under both Agri-PV systems remained consistently high, averaging 1.67 to 1.69 g cm−³ at 70–75 cm depth. Individual sampling points reached harmful levels of 1.86 to 1.99 g cm−³ in the Agri-PV subsoil.
Fig. 2
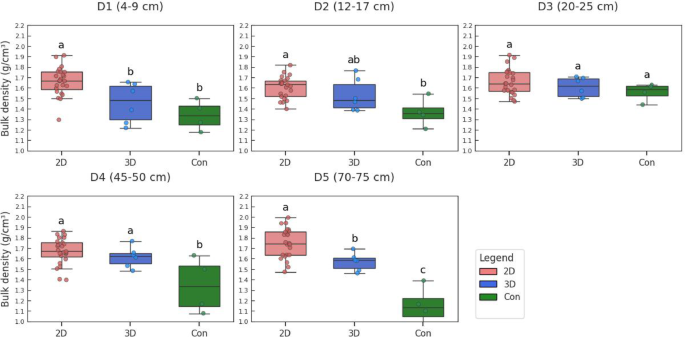
Bulk density (in g cm−³) at five depth intervals (D1: 4–9 cm, D2: 12–17 cm, D3: 20–25 cm, D4: 45–50 cm, D5: 70–75 cm) averaged for each agri-photovoltaics system (2D, 3D) and the control site (Con). Different letters indicate significant differences between systems (2D ( n=24), 3D ( n=6), Con ( n=4)) by Tukey test ( p<0.05) per depth layer. Note: agricultural (Ag) and pole (P) locations have been averaged in both Agri-photovoltaics systems.
Bulk density was significantly higher at both the pole (P) and agricultural (Ag) locations compared to the control site, with most pronounced differences observed in the subsoil layers (D4 and D5), but not in the intermediate layer (D3) (Fig. 3). No statistically significant differences were detected between P and Ag zones except in the topsoil, indicating a similar level of compaction below 9 cm soil depth across the entire 2D Agri-PV system. Values smaller than 1.4 g cm−³ indicate no subsoil compaction and were almost exclusively found at the control site.
Fig. 3
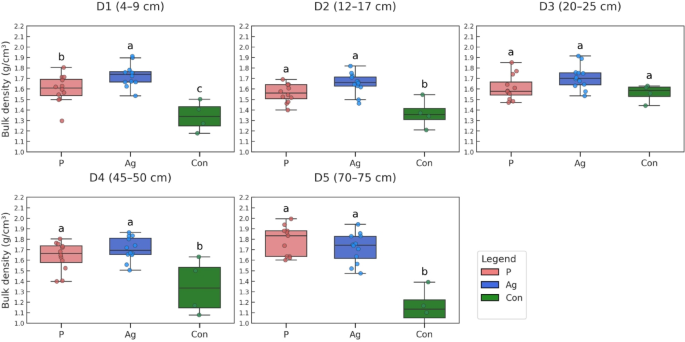
Bulk density (in g cm−³) at five depth intervals (D1: 4–9 cm, D2: 12–17 cm, D3: 20–25 cm, D4: 45–50 cm, D5: 70–75 cm) averaged over four transects in pole (P), agricultural (Ag) and control (Con) locations in the 2D system. Different letters indicate significant differences between locations (P ( n=12), Ag ( n=12), Con ( n=4)) by Tukey test ( p<0.05) per depth layer. Note: data from the single 3D transect has been excluded.
Across all five transects in 2D and 3D systems (excluding control site samples), bulk density values ranged from 1.30 to 1.99 g cm−³ across all depths, indicating a broad soil density spectrum within the Agri-PV site. Median values exceeded 1.6 g cm−³ in most transects (data not shown), particularly in deeper layers, suggesting a moderate to high level of subsoil compaction.
Penetration resistance
The highest average penetration resistance was recorded in the 20–25 cm depth interval (D3), reaching 4.1 MPa at agricultural (Ag) locations and 3.7 MPa near the pole (P) positions (Fig. 4). In contrast, the control site exhibited its highest average resistance of 4.7 MPa in the deepest layer (D5, 70–75 cm). However, it is important to note that the number of valid observations declined with increasing soil depth. This was primarily due to technical limitations of the penetrologger: in highly compacted soil layers, the device was either unable to fully penetrate the soil or returned negative, erroneous values due to excessive resistance. As a result, sampling points with extreme compaction, where penetration resistance likely exceeded critical thresholds, were systematically excluded from the dataset. This limitation suggests that actual compaction levels, particularly in the deeper layers under Agri-PV, may be underestimated in the present study. Thus, bulk density measurements in the subsoil provide complementary evidence of compaction, particularly in those layers where penetration resistance measurements were limited.
Fig. 4
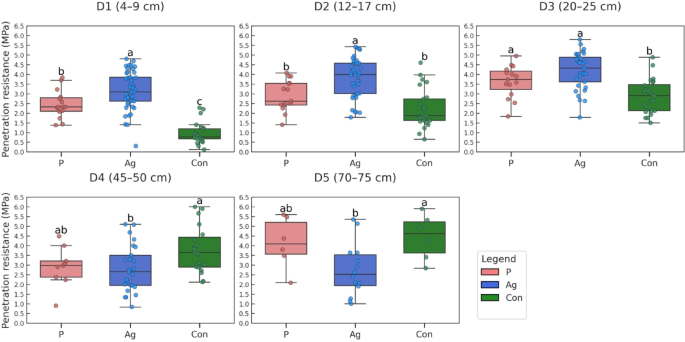
Soil penetration resistance (in MPa) at five depth intervals (D1: 4–9 cm, D2: 12–17 cm, D3: 20–25 cm, D4: 45–50 cm, D5: 70–75 cm) averaged over five transects in pole (P), agricultural (Ag) and control (Con) locations within the 2D system. Different letters indicate significant differences between locations (P ( n=15), Ag ( n=45), Con ( n=25) in D1) by Tukey test ( p<0.05) per depth layer. Note: data from the 3D transects are not included.
Penetration resistance was elevated in the Agri-PV locations, particularly in the topsoil (D1) and mid-depth (D3) layer, while differences were less pronounced in D2. Higher penetration resistance was not confined to structural site elements (e.g., poles) but extended into the agricultural production area, likely as a result of frequent construction traffic between the tracking rows during the installation of the panels. In the subsoil layers (D4 and D5, 45–75 cm), no significant differences were observed between locations. However, median values in D4 and D5 were highest at the control site (Fig. 4), possibly due to pre-existing site conditions but also caused by exclusion of high (negative) resistance data from Ag and P locations. Among all locations, the agricultural area showed the greatest variability in penetration resistance, as indicated by wide ranges between minimum and maximum values. This suggests spatially heterogeneous compaction, potentially caused by uneven machinery movement or localized differences in soil texture and moisture conditions during the construction phase.
The centimeter-wise soil profile revealed substantially lower penetration resistance at the control sites (Con) up to a depth of 30 cm, followed by a pronounced increase in resistance with depth (Fig. 5). In contrast, the agricultural sampling locations exhibited the highest penetration resistance values within the upper 30 cm, suggesting surface and near-surface compaction likely caused by machinery traffic during Agri-PV construction. At greater depths, the control site showed the highest penetration resistance, pointing to pre-existing subsoil compaction unrelated to the Agri-PV installation. Spatial variability between transects (SE in Fig. 5) was low in the top 30 cm but increased notably with depth. Again, the number of valid observations decreased in deeper layers due to erroneous readings from the penetrologger, which failed to penetrate highly compacted soil or exceeded its operational limits.
Fig. 5
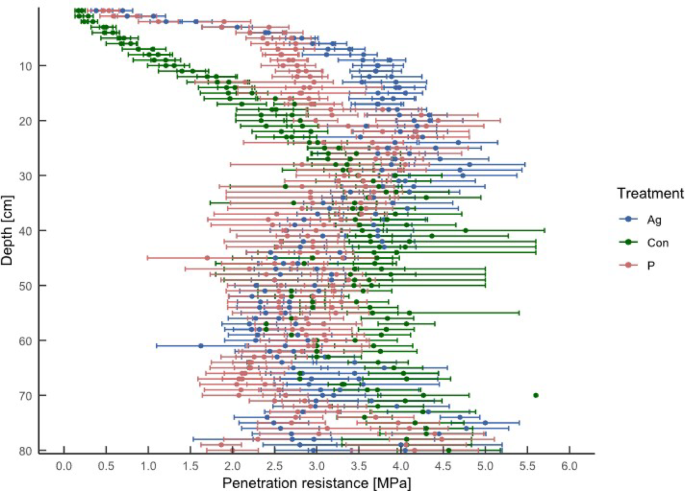
Depth profile of soil penetration resistance (in MPa) measured in 1 cm increments down to 80 cm depth. Data represent averaged values of seven transects across both Agri-PV systems (2D and 3D) at pole (P), agricultural (Ag) and control (Con) locations. Dots and horizonal lines indicate the mean ± standard error SE.
A slight positive significant relationship between bulk density and penetration resistance was only observed in the first depth interval (D1) (Fig. 6). However, due to the limited number of data pairs available for the control sites (maximum of four), no robust individual correlation analysis could be performed for this location.
Fig. 6

Regression analysis between data pairs of penetration resistance and bulk density obtained from five transects, three different locations and both Agri-PV systems, considering depth D1 from 4–9 cm, where a significant, but weak relationship was observed.
Discussion
Bulk density exceeds established compaction thresholds
Bulk density (BD) values obtained at the Agri-PV site clearly exceeded those of the control site, representing pre-construction conditions. BD values of the control averaged 1.34–1.56 g cm−³ in the first three layers, whereas values in the Agri-PV systems ranged from 1.62 to 1.65 g cm−³. This is comparable to mean BD values between 1.4 and 1.6 g cm−³ in sandy soils analyzed through a German mechanical soil data base by Schroeder et al.35. In a recent European assessment, bulk density in agricultural soils averaged only 1.26 g cm− 3, with values above 1.5 g cm−³ rarely occurring36. In the subsoil (D4, D5), discrepancies grew with average values of 1.34 and 1.14 g cm−³ at the control site, but 1.66 and 1.68 g cm−³ at the Agri-PV site. This increase is most plausibly related to frequent movement of heavy machinery during installation, although contributions from pre-existing subsoil conditions cannot be fully excluded. Ten sampling locations on the Agri-PV transects showed BD values higher than 1.8 g cm−³, a level commonly associated with severe mechanical compaction and restricted root growth in coarse-textured soils37.
The BD values under the Agri-PV system were considerably above 1.61 g cm− 3, a locally established threshold that Frielinghaus et al.38 identified as a Level 3 compaction risk in slightly silty sands, linked to yield declines of 10%. Since one third of our sampling points exceeded BD values even above 1.71 g cm−³ across depths, future negative effects on root development and crop performance cannot be excluded38. However, the magnitude of yield reduction will depend on crop species, soil texture, climatic conditions, and management. Locally, a study by Hofbauer et al.39, in a similar soil type showed that an increased BD of 1.66 g cm−³ in 6 cm depth caused by shallow non-inversion tillage restricted nitrogen mineralization and root development, together declining rye yields by 22–43%.
We further assume germination problems and reduced root growth in future crop production under this Agri-PV system, as recently assessed for wheat in a sandy loam at a compaction level of 1.7 g cm−³40. This aligns with findings from a global meta-analysis by Zhang et al.41, who reported an average bulk density of 1.71 g cm−³ and 1.77 g cm−³ for compacted coarse-textured soils in 0–30 and 30–40 cm, respectively and found significant yield depressions starting at 1.6 g cm−³ for crops like wheat and maize. In loamy sands, bulk densities above ~ 1.6 g cm−³ have been frequently reported to restrict root growth, and values above 1.8 g cm−³ may fully inhibit root development (42, 43).
Compaction of this magnitude is particularly concerning in coarse-textured sandy soils, which are highly vulnerable due to their low clay content and weak aggregate stability44. In contrast to finer-textured soils, sandy soils lack shrink–swell capacity and exhibit lower biological activity, both of which limit their natural ability to recover from mechanical disturbance45, 46. These characteristics suggest a comparatively limited natural recovery potential compared with finer-textured soils, meaning that compaction effects may persist for extended periods. The risk was likely increased during Agri-PV installation, as soil moisture levels at that time (Fig. 1) were elevated and reached field capacity in some zones (Fig. 1; Table 1). High soil water content near field capacity is a well-known driver of rapid compaction because water reduces interparticle friction and facilitates particle rearrangement under machinery load18, 47. While dry soils are less prone to compaction due to increased cohesion, fully saturated soils also become less compactable due to water occupying all pore spaces48. Sandy soils and slightly silty sands reach saturation at comparatively low moisture contents of around 30% and field capacity at 20–25 vol.-%49 which has been reached in several occasions across depths and transects. This narrow margin between field capacity and saturation makes them especially susceptible to machinery passes during wet periods, particularly under heavy axle loads.
Penetration resistance confirms mechanical compaction
Penetration resistance (PR) results from the Agri-PV site further support the diagnosis of severe compaction. Mid-depth layers (D3) showed mean PR values of 3.7–4.1 MPa at the P and Ag locations of the Agri-PV site, surpassing the commonly accepted root growth threshold of 2–3 MPa41 (Fig. 4). About 70% of crop roots typically occupy the upper 30 cm soil profile50, indicating a strong potential for mechanical impedance in those depths with PR above 3 MPa which was the case in many agricultural locations at the Agri-PV site, thus potentially limiting root penetration and restricting root elongation51.
This mechanical impedance assumption is consistent with observations from compacted coarse soils globally. In the same meta-analysis by Zhang et al.41, PR values under compaction averaged 2.5 MPa, increasing to 5.5 MPa at 30–40 cm in severely compacted sandy sites. In the Agri-PV site, several PR measurements exceeded this value in the intermediate depth. Moderate passes with machinery caused PR to increase by 245% in coarse-textured soils and resulted in an average yield decrease of corn and soybean by 34%, by 16% for barley and by 6% for wheat52. However, PR levels were similar in the deeper layers D4 and D5 at the control sites, suggesting comparable levels of soil stress and subsoil compaction. Thus, subsoil compaction cannot exclusively be linked to recent construction activities but may partly reflect pre-existing site conditions, such as pedogenic densification, historical land use, or natural variability in soil composition.
The data also reveals considerable variability of PR in the Ag locations, indicating heterogeneous compaction patterns, likely due to uneven and uncontrolled trafficking during the construction phase and inherent soil properties of texture and moisture. Such heterogeneity in form of patchy compaction zones is typical where traffic concentrates along informal lanes, turning points, or equipment loading areas, rather than being confined to designated tracks53. Interpretation of PR should be made with caution, as soil moisture at the time of measurement varied considerably among transects (14–22 vol.-% at 45 cm depth, Fig. 1). Consequently, part of the observed variability in PR likely reflects differences in soil water content in addition to machinery traffic effects.
While PR and BD are often correlated, this relationship is highly dependent on soil moisture and soil type. In our dataset, this relationship was weak and only observed in the topsoil (Fig. 6), likely reflecting spatial heterogeneity and variable water contents at the time of measurements and sampling. While Lardy et al.54 found a strong linear relationship under controlled conditions, PR variability increased with lower water content. However, authors collected bulk density data in a range from 1.2 to 1.6 g cm-3, leaving little room for interpretation in highly compacted soils. Costantini55 cautioned against predicting PR from BD or moisture alone, highlighting the value of measuring both indicators independently but in parallel.
Avoiding compaction during construction and options for recovery
The severity and spatial extent of compaction observed in this study calls for preventative measures during the Agri-PV construction. In our study, soil compaction occurred around pole bases (due to direct construction impacts), but also across the wider agricultural area between the poles. There was uncontrolled movement of heavy equipment, also under unfavorable weather conditions due to the timing of construction during late autumn and early winter.
To reduce such negative impacts, regulations are being developed. The DIN SPEC 91,434 (2021-05) is the norm for Agri-PV systems and describes the requirements for primary agricultural use in Germany. It ensures that the primary focus of Agri-PV installations remains on agricultural land use. Consequently, soil protection is identified as one of the key principles within this standard, which explicitly outlines measures to prevent soil compaction. These measures include, for example, the use of temporary driving paths and specialized tires, and recommend vehicular traffic to periods under dry conditions (DIN, 2021).
Thus, our study supports the need for more critical pedological construction supervision (PCS). This should involve monitoring of soil protection by qualified personnel throughout planning, execution, and post-construction restoration56. Rigorous PCS could provide site-specific recommendations to schedule construction avoiding wet conditions which was not fully possible for the current site due to the very tight project finance- and timeframe imposed by the funding agency. Also, limiting traffic to designated lanes or use of temporary trackways and subsoil protection mats would have been a suitable compaction risk minimization strategy.
Natural processes of freezing/thawing, wetting/drying, and bioactivity can alleviate topsoil compaction57. While post-hoc measures for the recovery of compacted soils are available, including mechanical/physical (tillage), biological (earthworms, deep rooting crops) and chemical (lime or manure incorporation) methods58, these cannot fully compensate for deep compaction, particularly in sandy soils that lack natural recovery processes45, 46. Therefore, continuous monitoring of post-construction recovery and future recommendations on subsoiling/deep tillage were put into practice and a combination of mechanical (tillage) and biological (perennial alfalfa cultivation for 2–3 years) was implemented on our study site.
While the risks and mechanisms of soil compaction are well-established in soil science and agronomy, this is not yet the case for companies constructing Agri-PV systems on arable land. When the aim is to increase Agri-PV systems across Europe, greater attention is needed during the planning and implementation phase to avoid soil compaction as much as possible. Policy incentives that emphasize rigid deadlines may inadvertently promote construction activities under sub-optimal conditions, leading to elevated compaction risk. Costs associated with the measures against compaction need to be considered. Immediate post-installation evaluation followed by reassessment three to five years later can provide data on soil structural recovery.
Study limitations due to experimental design and method selection
Several limitations should be considered when interpreting the observed compaction patterns. First, the inherent spatial heterogeneity of the site, including variations in soil texture, carbon and moisture, may have contributed to part of the variability observed in both bulk density and penetration resistance. However, the consistent increase in bulk density across multiple depths and transects suggests a systematic effect beyond random spatial variability.
Second, the comparability of the control site is limited, as pre-existing soil conditions and management history are not fully known and field edge effects limit its representability. The relatively high subsoil penetration resistance observed at the control site suggests that background soil conditions or prior management may have contributed to baseline compaction levels. This limits the extent to which subsoil differences can be attributed exclusively to construction effects. On the other hand, the small distance between Agri-PV treatment and the control plots ensures most similar soil types for sampling conditions and measured topsoil effects can only be attributed to recent machinery passings which were visually absent from the control site.
Third, sampling accessibility, particularly in compacted subsoil layers, may have constrained measurements. It should be noted that penetration resistance measurements were limited in highly compacted layers due to technical constraints of the penetrologger. As a result, peak compaction levels may be underestimated but were still captured with bulk density assessment.
Finally, while differences between pole and agricultural zones were assessed, the lack of consistent significant differences suggests that traffic intensity and construction processes affected the entire site more uniformly than initially assumed.
Conclusions
Physical soil properties at the Agri-PV site frequently exceed commonly used compaction thresholds reported for coarse-textured agricultural soils. Bulk density values above 1.67 g cm-³ and penetration resistance levels exceeding 3.7 MPa indicate severe mechanical compaction, far beyond levels known to restrict root elongation, reduce crop yields, and impair key soil functions such as infiltration and nutrient cycling. These consequences are well documented in literature and reflect significant risks for agricultural productivity and long-term soil functioning. The weak structural integrity of sandy loams, characterized by low clay content and limited shrink-swell potential, suggests that natural soil recovery processes will be limited at the study site without mechanical intervention.
The inherent heterogeneity of the site limits the extent to which construction-induced effects can be fully separated from background soil variability. However, the magnitude and consistency of observed compaction patterns in both, bulk density and penetration resistance across multiple transects provides independent evidence of construction-related soil compaction. The combined assessment of bulk density and penetration resistance proved valuable, as both indicators complemented each other and helped identify compaction patterns in space and depth despite limitations associated with individual methods.
Our findings strongly justify the implementation of pedological construction supervision in Agri-PV developments, particularly in sandy-soil regions where natural decompaction processes are limited. Proactive soil management strategies should become standard practice, including careful planning of construction timing, load restrictions during wet conditions, and the use of mitigation techniques such as controlled traffic lanes and temporary trackways. Agri-PV projects should incorporate pre-construction soil assessments and post-construction monitoring to better quantify changes attributable to installation and support targeted recovery measures.
To maintain productivity on agricultural land under Agri-PV, controlled traffic farming principles should be prioritized, starting already in the planning phase for construction machinery and to be continued during agricultural management with field machinery. This would help minimize further soil degradation by machinery, ensure long-term land usability, and align Agri-PV development with sustainable land stewardship principles. The usage of light-weight agricultural robotics could enable further soil protection after installation. Further studies across different soil types and Agri-PV configurations are needed to evaluate the transferability of these findings and to improve understanding of soil recovery processes following installation59.
Materials and methods
Site description
The study site is located on a 0.75 ha field at the research station of the Leibniz Centre for Agricultural Landscape Research (ZALF) in the city of Müncheberg (52.52° latitude, 14.12° longitude, and 63 m above sea level) in Brandenburg


