
The AI Boom Could Triple Data Center Water Use by 2030
By Rystad Energy - Aug 28, 2026, 2:00 PM CDT
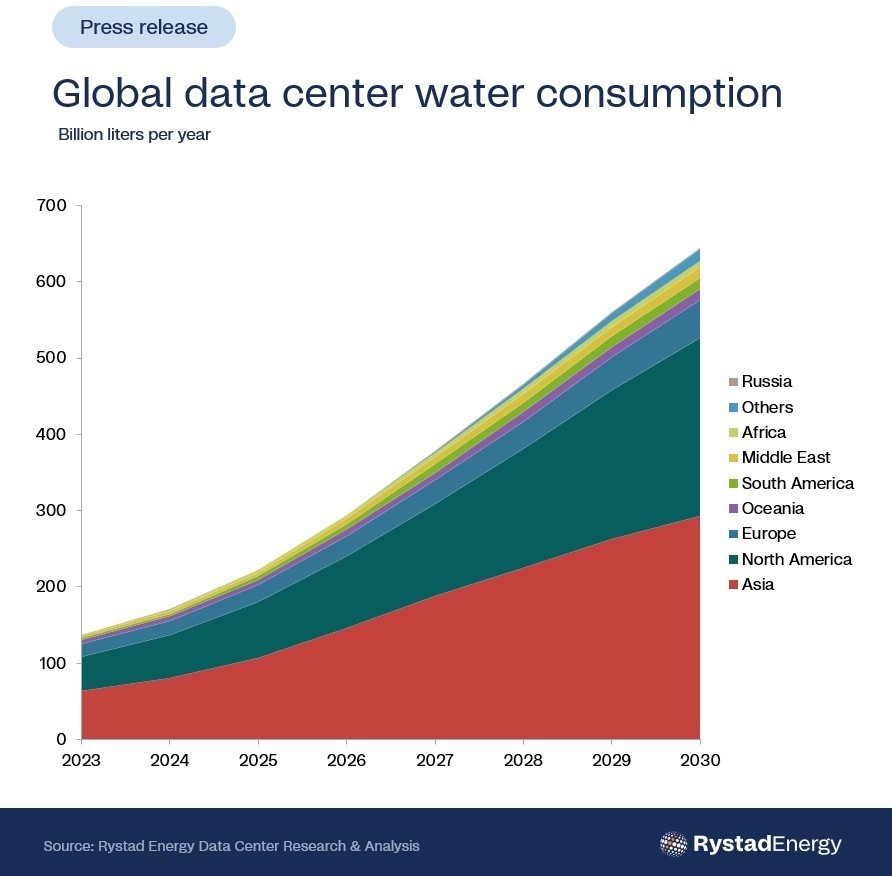
- Rystad Energy estimates direct data center cooling-water consumption could rise from 222 billion liters in 2025 to nearly 644 billion liters in 2030, while aggressive conservation could limit it to 388 billion liters.
- Cooling technology, climate, and electricity supply can dramatically alter a facility’s total water footprint, creating trade-offs between direct water consumption and power demand.
- Operators report widely varying water-use intensities, while governments are beginning to introduce reporting, efficiency, and development requirements as data centers expand into water-stressed regions.

The massive data center capacity scale-up underway has focused attention on the scale of water required for these facilities to operate. Rystad Energy estimates that without water-saving measures in place, global water consumption by data centers could rise to 644 billion liters per year by 2030. However, active mitigation could reduce demand to 388 billion liters, representing worst- and best-case scenarios as data center capacity ramps up, driven largely by the growing adoption of artificial intelligence (AI) in everyday life.
Forecasting the water impact of data centers is far from straightforward, with consumption varying significantly depending on cooling technology, climate and whether we measure water withdrawn or water actually consumed. Based on Rystad Energy estimates, data centers consumed 222 billion liters of water directly for cooling in 2025, but that figure could nearly triple to just under 644 billion liters by 2030 in our risked central case. More water-efficient pathways could bring this down to 543 billion liters in the moderate case or as low as 388 billion liters in an aggressive water-saving scenario. These figures only capture direct cooling-water consumption, while the less visible water footprint embedded in the electricity supply adds another layer of complexity,
Minh Khoi Le, Global Head of Data Center & Hydrogen Research, Rystad Energy
Technology variations
Data centers use water primarily to remove the heat generated by computing equipment, but consumption varies significantly depending on the cooling technology and location. While AI servers generate substantially more heat, the rise of AI does not necessarily mean a proportional increase in water consumption, as rack-level liquid cooling can reduce the heat burden on facility-level systems and enable greater use of dry cooling. Technologies such as those proposed for NVIDIA’s Vera Rubin platform could therefore help limit water use, although the potential savings remain highly dependent on climate, with dry cooling generally more effective in colder locations.
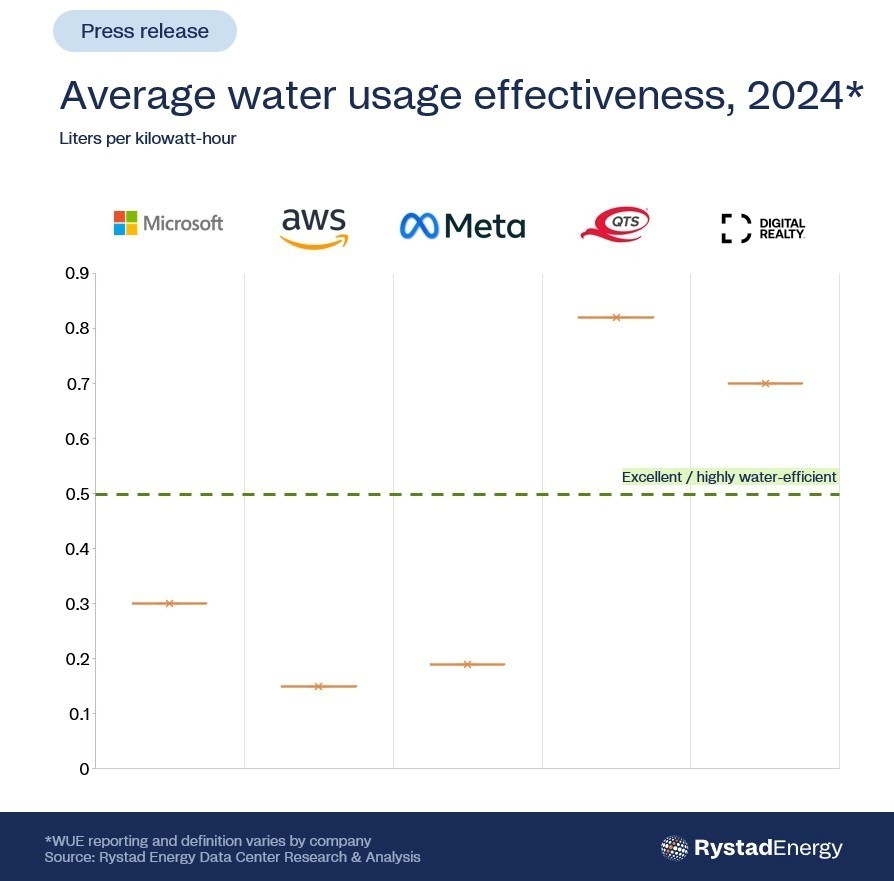
More than just on-site water consumption, a useful metric to consider is water-use effectiveness (WUE), the industry measure of water used per unit of IT energy, which can also account for the water consumed to generate the electricity used by a data center. Some cooling technologies can reduce on-site water use but require more electricity. For example, dry cooling can save around 2.15 liters of water for every kWh of IT load, but requires an additional 0.30–0.74 kWh of electricity. The indirect water footprint can be material relative to direct consumption, but its contribution varies significantly depending on the water intensity of the electricity supply. For instance, the indirect portion of water consumption by data center in US can be more than twice that of direct water consumption. The overall water footprint of a data center therefore depends on both its on-site cooling system and the water intensity of the electricity it consumes.
Operator dimension adds another complication
Since there is no general requirement for WUE standards in most regions, design choices vary widely among operators, even within the same climate zones. Globally, Amazon Web Services (AWS) reported an average direct site WUE of 0.12 liters per kWh in 2025, Meta reported 0.19 liters per kWh for 2024, and Microsoft reported 0.27 liters per kWh for fiscal 2025. Digital Realty reported 0.59 liters per kWh and Equinix 0.91 liters per kWh in 2025. Google's disclosed data imply a materially higher intensity, although the company does not publish an official WUE figure.
These values should not be read as a simple ranking, given differences in the treatment of leased and colocation facilities and variation in regional portfolios. There are also differences in the underlying calculation: AWS and Meta define site WUE as water withdrawal per IT capacity, as opposed to water consumption. AWS's own 2025 regional values ranged from 0.02 liters per kWh in Stockholm to 2.85 liters per kWh in Jakarta – a spread of more than 100 times within one operator's reporting framework, underscoring how strongly geography and cooling architecture influence the metric.
Major data center operators, including hyperscalers such as AWS, Google, Microsoft and Meta, have committed to using water more sustainably. All four have set targets to become “water positive” by 2030, meaning they aim to replenish more water than they consume. They are working on projects to restore freshwater supplies and improve water efficiency, including in sectors such as agriculture. However, these efforts vary by location and watershed, with greater focus often placed on areas facing high water stress. As a result, the impact on local water resources will vary.
Regulation is emerging, but reporting still leads enforcement
WUE regulation has started to emerge, but often stops at reporting requirements rather than performance mandates. The EU Commission is planning a Data Center Energy Efficiency package that would introduce a labeling system and performance standards, while Singapore's Green Data Center Roadmap aims for less than 2 cubic meters per megawatt-hour (MWh), equivalent to 2 liters per kWh. Regulations are developing in the US but vary widely by state. Texas, for example, recently has imposed a moratorium on new approvals pending audits of the tax breaks, power, water, and cooling use associated with data centers.
Water stress will also be an increasingly important consideration for data center regulation, as water demand is set to grow in regions that already face significant constraints on availability. Regions with high and extremely high water stress are projected to account for 34% of the data center sector’s total global direct water consumption by 2030. Requiring the adoption of the least water-intensive cooling technologies could reduce consumption in these regions by 45%, highlighting the potential impact of technology standards in water-stressed areas. Some of the most exposed areas globally include Jamnagar and Thane in India and Reeves County in Texas, where data center water consumption is high relative to local water stress.
More Top Reads From Oilprice.com
- Aramco Finds a New Way to Keep Saudi Crude Flowing to China
- MIT Uses AI to Challenge a Century-Old Process for Mass Ammonia Production
- Qatar and Kuwait Restore 70% of Pre-War Oil Exports Through Hormuz
Download The Free Oilprice App Today


ADVERTISEMENT
Set us as your preferred Google source
FACEBOOK Twitter LINKEDIN REDDIT PRINT
Previous Post\n\nRussia’s Energy Crisis Puts Kazakhstan in a Tough Spot Next Post\n\nEurope’s Russia Sanctions Have a Major Blind Spot

Rystad Energy
Rystad Energy is an independent energy consulting services and business intelligence provider offering global databases, strategic advisory and research products for energy companies and suppliers,…
Related posts
U.S. Oil Rig Count Falls by 5 as Gas Rigs Rise Oil Shrugs Off Trump’s ‘Toughest Sanctions in History’ Europe’s Russia Sanctions Have a Major Blind Spot
Leave a comment
First Name
Last Name
That email address is already in the database. Please login to your account to post your comment, or enter a different email address to continue with your comment & account creation.
Captcha
Comment
Please understand that, by submitting this form, you will be creating a free OilPrice.com account, and therefore agree to abide by our Terms of Use. Your details will be stored in our database and shared with our third party mailing list provider. You will be sent an email containing a link that will ask you to generate a new password - please follow the link to complete your OilPrice account activation.
We will save the information entered above in our website. Your comment will then await moderation from one of our team. If approved, your data will then be publically viewable on this article. Please confirm you understand and are happy with this and our privacy policy by ticking this box. You can withdraw your consent, or ask us to give you a copy of the information we have stored, at any time by contacting us.
ADVERTISEMENT
ADVERTISEMENT
Most Popular
 \n\nU.S. Refiners Face New Crude Squeeze as Canada Cuts Oil Sands Output
 \n\nOil Prices Fall as Iran Negotiation Hopes Return
  \n\nAramco Finds a New Way to Keep Saudi Crude Flowing to China
  \n\nThe Biggest Victims Of Trump’s Economic D-Day On Iran
  \n\nThe U.S. Power Play in Iraq That Moscow and Beijing Didn’t See Coming

ADVERTISEMENT
ADVERTISEMENT
EXXON Mobil-0.35
Open57.81Trading Vol.6.96MPrevious Vol.241.7B
BUY 57.15
Sell 57.00


