
Figma vs. IBM: What Revenue Growth Trends Tell Investors About the Young Software Design Company and the Veteran Artificial Intelligence Tech Giant
By Robert Izquierdo–Jul 25, 2026 at 6:15PM EST
Key Points
- Figma shows stronger and more consistent revenue momentum compared to International Business Machines.
- Figma posted uninterrupted quarter-over-quarter revenue growth, while IBM experienced ongoing volatility in its totals.
- Investors should watch whether the two companies see their revenue growth trajectories converge or if the current growth gap continues to widen.
- 10 stocks we like better than Figma ›
Figma: Sustaining Consistent Revenue Growth
Figma( FIG +5.85%) generates revenue by selling subscriptions to its collaborative, browser-based design and prototyping software.
It introduced new timeline-based animation tools at its annual conference in June 2026, and it reported approximately -43% net income margin for the quarter ended March 31, 2026.
IBM: Navigating Revenue Fluctuations
International Business Machines( IBM +3.65%) delivers comprehensive technology solutions, consulting services, and hybrid cloud infrastructure to global enterprise clients.
It disclosed a shortfall in preliminary results on July 14, 2026, while recording a 15% EBIT margin for the quarter ended June 30, 2026.
Why Revenue Matters for Retail Investors
Revenue shows investors the total money coming into a business before expenses are deducted. Tracking this figure helps investors understand the total scale and top-line growth trajectory of a business.
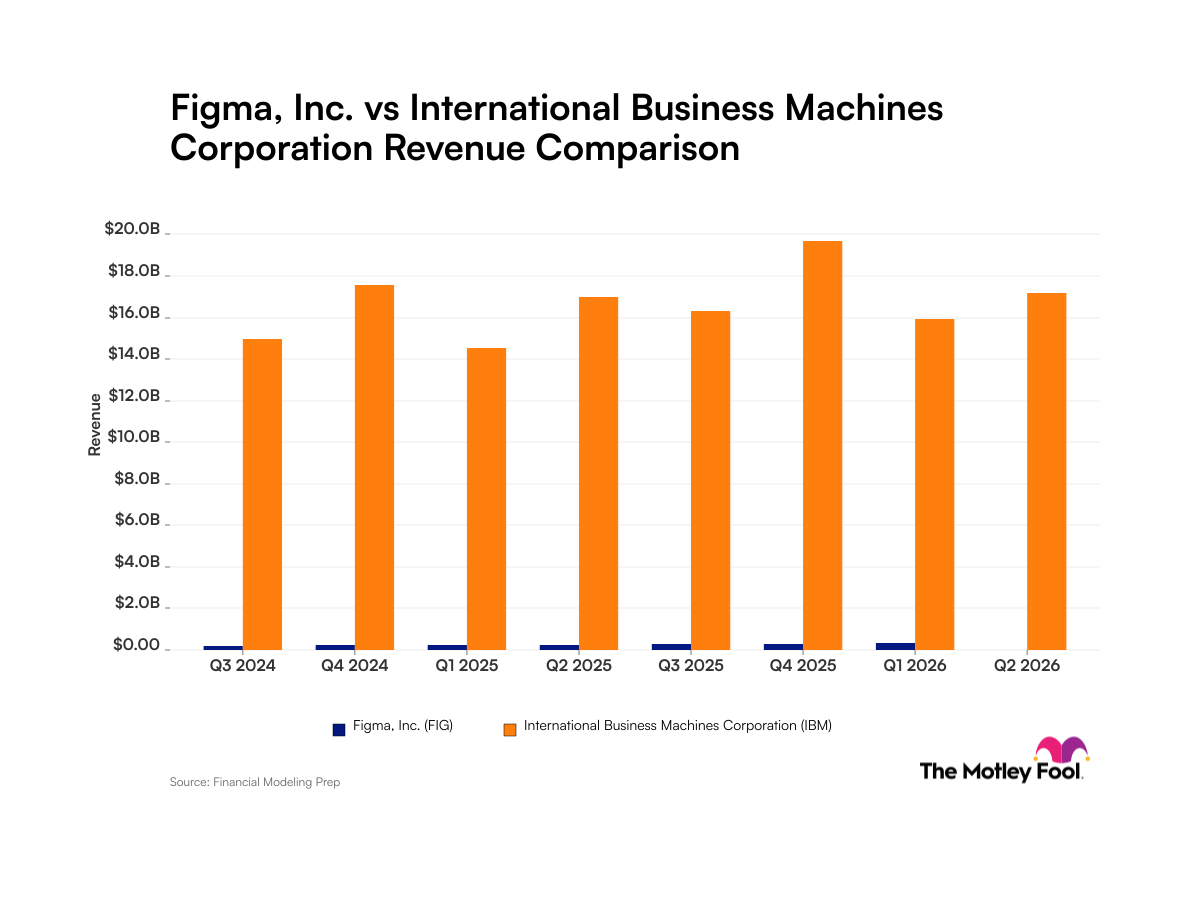
Quarterly Revenue for Figma and International Business Machines
| Quarter (Period End) | Figma Revenue | International Business Machines Revenue |
|---|---|---|
| Q3 2024 (Sept. 2024) | $198.6 million | $15.0 billion |
| Q4 2024 (Dec. 2024) | $216.9 million | $17.6 billion |
| Q1 2025 (March 2025) | $228.2 million | $14.5 billion |
| Q2 2025 (June 2025) | $249.6 million | $17.0 billion |
| Q3 2025 (Sept. 2025) | $274.2 million | $16.3 billion |
| Q4 2025 (Dec. 2025) | $303.8 million | $19.7 billion |
| Q1 2026 (March 2026) | $333.4 million | $15.9 billion |
| Q2 2026 | Not yet reported | $17.2 billion (period ended June 2026) |
Data source: Company filings. Data as of July 24, 2026.
Foolish Take
Venerable IBM’s revenue towers over newcomer Figma’s sales, but that’s to be expected given the former has existed for over a century. IBM has transformed its business substantially over that time. It now focuses on the fast-growing artificial intelligence sector, providing software and cloud infrastructure for customers seeking to adopt AI, as well as an army of consultants to help clients navigate how to do so.
IBM’s volatile sales trend speaks to the choppy nature of selling hardware and consulting services. Its zSystems line of computer mainframes incorporating AI were a hot seller when they launched last year, but in the second quarter of 2026, Z sales were down 42% year over year. This combined with missing Wall Street’s Q2 revenue expectations amid the AI boom understandably worried investors, sending IBM shares to a 52-week low of $199.19 on July 23.
Figma’s revenue trend speaks volumes about the success of its business. The company’s Q1 sales of $333.4 million represented amazing 46% year-over-year growth as it continued to produce quarterly increases. That trend is expected to extend into Q2 with a forecast of revenue between $348 million to $350 million.
Where to invest $1,000 right now
When our analyst team has a stock tip, it can pay to listen. After all, Stock Advisor’s total average return is 896% — a market-crushing outperformance compared to 206% for the S&P 500.
They just revealed what they believe are the 10 best stocks for investors to buy right now…
*Stock Advisor returns as of July 20, 2026
Figma’s design products are clearly winning over customers. Yet its stock fell to a 52-week low of $16.60 in April after Wall Street became concerned AI’s ability to quickly generate images on the fly would take business away from Figma. The company’s sales trend reveals this isn’t happening, and in fact, its business is thriving.
Should you buy stock in Figma right now?
Before you buy stock inFigma, consider this:
The Motley Fool Stock Advisor analyst team just identified what they believe are the 10 best stocks for investors to buy now… and the Figmawasn’t one of them. The 10 stocks that made the cut are built for long-term growth and could produce monster returns in the coming years.
Consider when Netflix made this list on December 17, 2004... if you invested $1,000 at the time of our recommendation, you’d have $377,990! Or when Nvidia made this list on April 15, 2005... if you invested $1,000 at the time of our recommendation, you’d have $1,269,518!
That performance is why people listen. With a track record of beating the S&P 500 by 4x, Stock Advisor offers a distinct advantage. Don't miss Stock Advisor's latest top 10 stocks, and join an investing community built for the long haul.
*Stock Advisor returns as of July 25, 2026.


