
主次节奏:6.28 Gold - Weekly Trend Review
This article is updated every Sunday to analyze the gold trend at various levels.
Gold Monthly Chart (Ultra-Long Term)
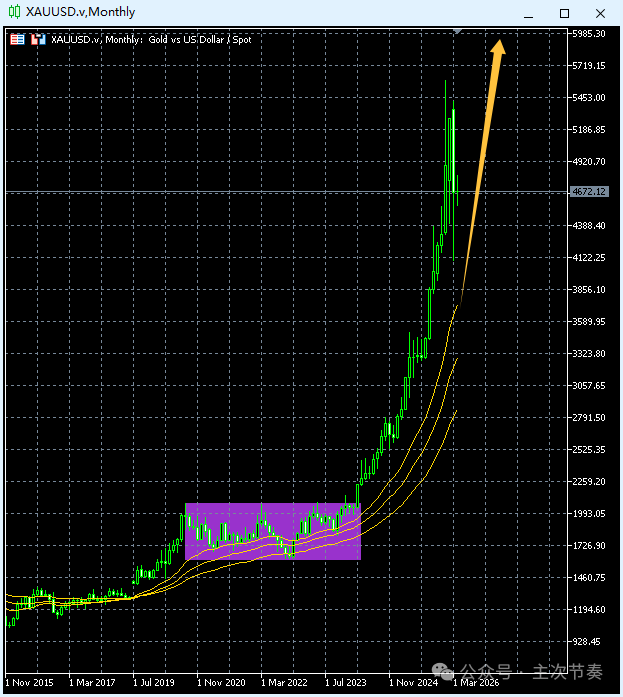
Monthly chart: 1-2 year trend expectation Screenshot time: 2026.4.5
Objective trend: Up Primary rhythm: Main upward Inception: 2026-1-4
From a technical perspective, gold's current monthly rally began after breaking out of the ultra-large consolidation range from 2020-2023. From a fundamental perspective, the past few years have been accompanied by worsening global situations, including geopolitical and economic factors, which together have driven this super bull market.
In the past two years, gold has been in a continuous strong upward trend. Based on wave analysis, this is likely wave 3 of a certain stage. It is foreseeable that in 2026, gold will continue to set new all-time highs. However, one should be cautious about increased high-level fluctuations (after a sharp rise in wave 3, wave 4 will eventually arrive; we do not predict its immediate onset, but it will come one day).
In a bull market, do not guess the top, and do not predict the start of wave 4. The prudent approach is to wait for a pullback to confirm.
Update: 2026-4-5
The three monthly candlesticks since January 2026 all have long upper or lower shadows, indicating severe volatility. March showed the first significant bearish candle in quite some time.
Thus, the current high-level consolidation can be seen as a large-scale correction, but it is unknown how much it will expand in time and amplitude. It could be wave 4 on the monthly chart or just a weekly-level pullback.
Regardless, the ultra-long-term uptrend of gold on the monthly chart remains unchanged.
Gold Weekly Chart (Long Term)
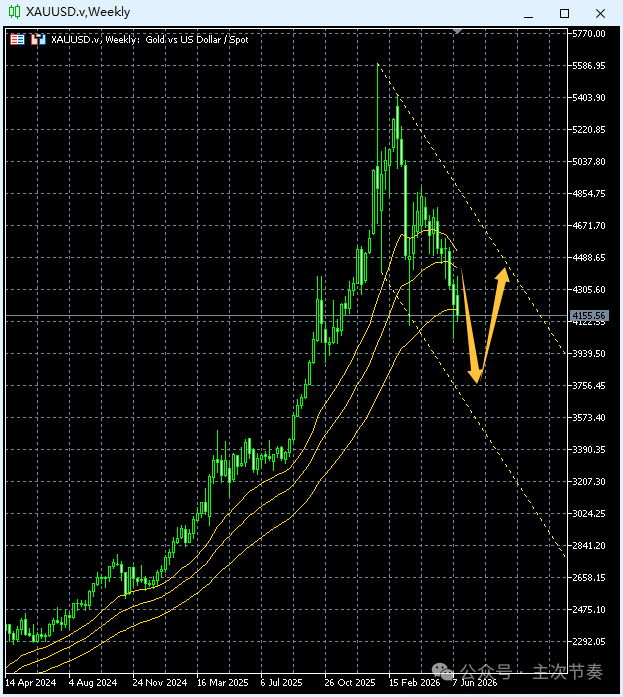
Weekly chart: 3-5 month trend expectation Screenshot date: 2026.6.21
Objective trend: Transition Primary rhythm: Main upward (alternating momentum) Inception: 2026-6-21
The current weekly-level pullback is unfolding in a flag channel (see chart above), with a slope slightly greater than 45 degrees, indicating moderate-to-high correction strength.
After repeatedly breaking below the moving average system support in the past two weeks, a breakdown is now preferred. This suggests the pullback will deepen further.
The next expected rhythm: down then up within the flag channel.
Gold Daily Chart (Medium Term)
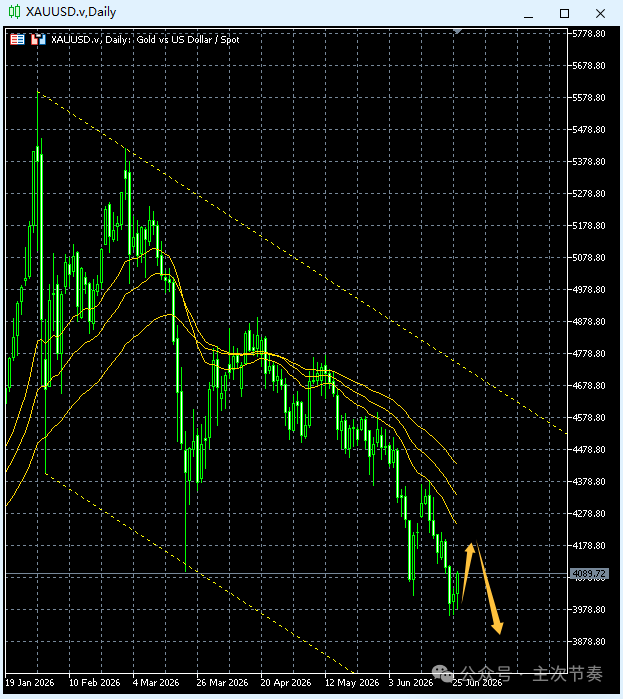
Daily chart: 2-3 week trend expectation Screenshot time: 2026.6.28
Objective trend: Down Primary rhythm: Main downward Inception: 2026-6-28
The previous low on the daily chart has been broken again. Under the bearish alignment of the moving average system, the medium-term trend remains bearish.
The recent decline appears to be a wide-range oscillating drop rather than a sharp one-way decline. There are no signs of a major rebound or bottom formation.
Gold 6-Hour Chart (Within the Week)
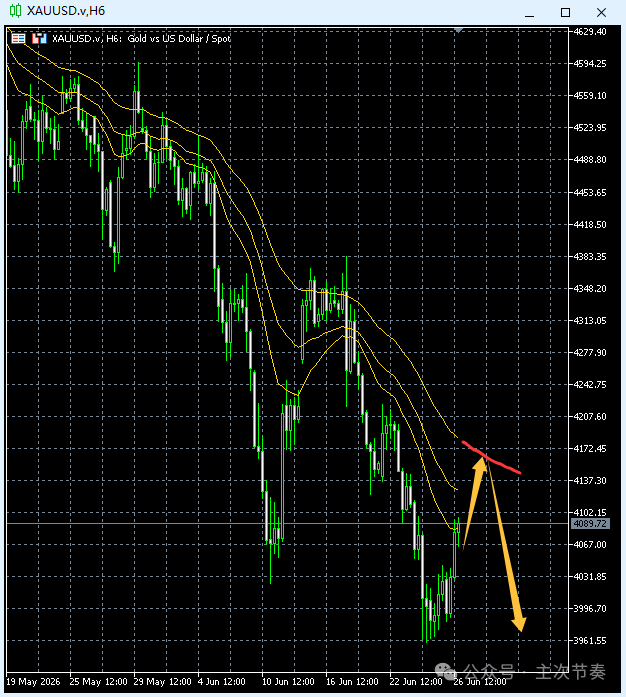
4-hour chart: 3-5 day trend expectation Screenshot time: 2026.6.28
Objective trend: Down Primary rhythm: Local momentum alternation Inception: 2026-6-28
Last week, gold remained weak overall, alternating between declines and rebounds, and made a new recent low. The bearish alignment of the moving average system confirms that gold remains on a downtrend.
Late Friday, short-term rebound momentum strengthened, showing some upside continuity, which may help the rebound extend, but its nature remains unchanged.
Therefore, gold is expected to have some rebound demand early this week, but under the pressure of the moving average system, it is likely to decline again afterward.
Instructions:
- Objective trend: Direction of the 21, 34, 55 exponential moving averages. Conclusion: Up, Down, Sideways, Transition.
- Primary rhythm: Direction of momentum continuation. Conclusion: Main upward, Main downward, Kinetic alternation.
- Logic between objective trend and primary rhythm: When contradictory, the primary rhythm is subordinate to the objective trend but serves as a risk expectation.
- Logic between timeframes: Smaller timeframe subordinates to larger timeframe; follow smaller timeframe first, then larger, considering exhaustion on smaller timeframe.
- This article is AI-assisted and for reference only. It does not constitute investment advice. Investment carries risk; gains and losses are borne by the investor.
Tags: Gold, Weekly Review, Technical Analysis


